What is a Yamazumi chart?
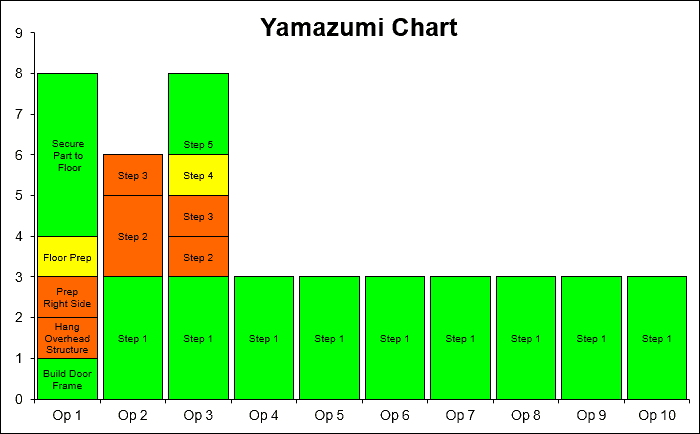
A Yamazumi chart is a stacked bar chart that shows the origin of cycle time in a given process. The chart is used to graphically display processes for optimization purposes.

See also :
- Procurement Price Tracker that can monitor 4.3 billion prices
- History and Possible Forms Of Transportation
- How Chat GPT Can Be Used To Optimize Supply Chain Management
- Refrigerated trucks – All you need to know
- What is Digital Supply Chain Management?
- What Does A Supply Chain Analyst Do?
What is Yamazumi?
Yamazumi, which is formed by the combination of the Japanese words Yama, which means Mountain, and Zuni, which means leveling; In Lean Thinking logic, it refers to a flattened sharing of the workload by ordering the work steps with each other in a smooth and balanced way.
By using the time measurement values of the work steps, the work steps are ordered in a logical sequence on a panel, not exceeding the takt time.
The most important point in Yamazumi is the distribution of work to operators based on the concept of takt time, which relates customer demand. Standard Business Forms and Business Standards must be properly set for effective Yamazumi operation. Otherwise, the balancing work remains only on paper.
The main purpose of Yamazumi studies is to increase man*hour labor efficiency by balancing the line with maximum efficiency.
What is Takt Time?
Takt time is a measure used to correlate the speed of production or service with customer demand.
It will meet the total demand created by customer requests; but at the same time it is possible to associate production with takt time so as to keep minimum inventory while meeting this demand. In order to produce with minimum stock, it should be aimed to measure the customer’s demand and to meet this demand in the foreseen time.
The ratio of your total available time for production or service to customer demand gives you the rate of meeting the unit product and/or service. This is called Takt Time.
How to Prepare a Yamazumi Chart?
In the Yamazumi graphic; Y axis represents cycle time, X axis represents each step of the process.
It should be worked on by recording with video during work at the workstation. Here, each work step and its durations should be examined one by one.
Value-added and non-value-added jobs should be separated from each other.
In the X and Y planes, X is the takt time; Y should be specified as operator or station.
The works done at each station should be placed on top of each other in order to be scaled. Businesses that produce added value and those that do not should be separated from each other. For this, the coloring process should be applied. For example, value-added jobs should be shown in green and non-value-added jobs in red.
The takt time should be marked on the graph and compared with the current situation. Unbalanced workloads that are running longer than the takt time and causing the line to slow down are thus identified.
With the work to be done, these works can be distributed to other stations and other improvement plans can be arranged.

Thus, with Yamazumi workforce balancing, the coordination between stations in a production facility is optimized.
Benefits of Yamazumi
The Yamazumi framework provides a mechanism to quickly rebalance a transaction when the exchange changes, visually showing which ones are overloaded and which are underutilized. The Yamazumi diagram is a great visual tool to show where lags, wastes, and locks occur.
A Yamazumi chart can help you quickly identify which processes are overloaded or underutilized. It is also useful when there is a need to rebalance the line or reorganize the process. This usually happens when the takt time changes. A Yamazumi chart also helps you compare performance between workstations or machines. By providing cycle time across all your lines, you can see which ones need to be optimized. Achieving a more balanced line will help you achieve predictability and ensure that customer demand is met on a consistent basis in a timely manner.
Popular Posts :
- How to Write a Supply Chain Resume Objective in 4 Steps
- Supply Chain Manager Interview questions and answers
- Are you ready to apply if you find your dream job today?
- What is Just in Time manufacturing (JIT)?
- Phrases To Sound More Confident In Interviews
- Procurement Price Tracker that can monitor 4.3 billion prices
- Nailing Your Niche
- Select A Career Based On Your Zodiac And Supporting Planets
- 12 Important Interview Questions to Prepare for Campus Placements
- Power of AI in Optimizing Supply Chain Operations
- Unfolding Innovations: E-commerce Marketing Trends of 2023
- Apple’s Leading Supply Chain
